Metrics
This page explains a few common metrics used in genetics & genomics.
N50
The N metrics are a measure of contiguity of a set of sequences often used to assess genome assemblies.
The N50 is related to the median and mean length of a set of sequences. Its value represents the length of the shortest read in the group of longest sequences that together represent (at least) 50% of the nucleotides in the set of sequences.
Example: Six reads of length 10, 11, 12, 13, 14, 15, 16. The combined length is 81 nucleotides and 50% = 40.5 nucleotides.
To get the N50 value start at the longest read and add the length of the next shorter one until you reach (at least) 50% of the total number of nucleotides:
16 + 15 + 14 = 45
The N50 value of this set of sequences is 14.
The N50 value can be seen as a weighted midpoint of the read length distribution of a sequencing run. However, the N50 value has to be interpreted in context of the total number of reads in a sequencing run. For example, a large number of very short reads may not have a big impact on the N50 value of a sequencing run but would arguably be worse than a sequencing run with less reads and similar N50 value.
Another common metric is the N90 value, representing the shortest read in the group of longest reads that together represent 90% of all the nucleotides.
In the example above the N90 value is 10.
- 3, 3, 3, 3, 3, 3, 3, 3, 3, 3, 25, 25, 150, 1500
- 50, 500, 530, 650
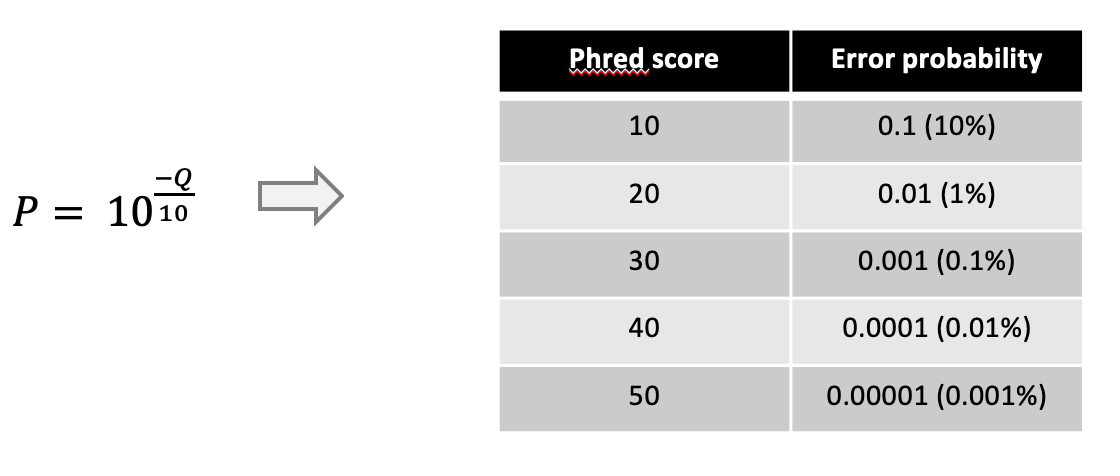
PHRED score
Phred scores are a measure of the quality of a sequencer’s base calling. It represents the logarithmic probability of a sequencing error for each nucleotide. Phred scores (Q) in a fastq file are represented as ASCII text to be able to assign one character to each nucleotide. In nanopore data the phred score is given as the integer value for the error probability P can be calculated through
Due to this the error probability for each nucleotide in a fastq file can be represented by a single character in line 4 of each sequence. Phred scores are encoded in 59 ASCII characters: from ASCII character “!” (decimal value 33) representing a PHRED score of “0” to ASCII character “~” (decimal value 92) representing a PHRED score of 58.